Performance Tests Don't Belong in Your PR Pipeline
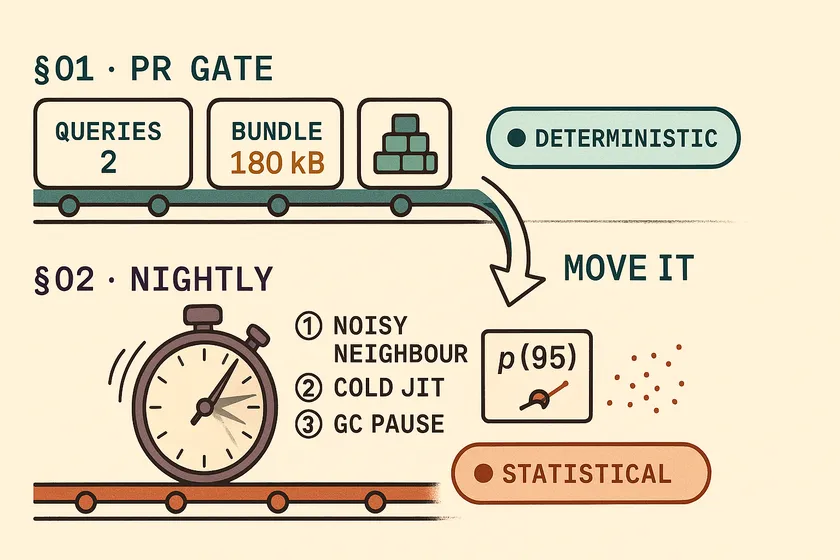
Table of Contents
Our performance gate blocked 41 pull requests in one quarter. Three of them had actually regressed performance. The other 38 were the runner having a bad day — a noisy neighbour on the hypervisor, a cold connection pool, a GC pause that landed inside the measurement window. We had wired an 18-minute k6 run into the PR pipeline at a large Canadian insurer, called it shift-left, and put it on a compliance slide. That was our performance testing CI pipeline strategy, and it was backwards.
The gate worked exactly as designed. That was the problem.
Any strategy here has to answer one question before it asks “how early can we run this?” — whether the thing you’re measuring is deterministic. Get that wrong and you don’t ship a quality gate. You ship a random number generator with merge-blocking privileges.
Why do performance tests fail randomly in CI?
Because a shared CI runner cannot measure time reliably. Your test isn’t measuring your code; it’s measuring whatever else is scheduled on that physical host. CodSpeed measured a 2.66% coefficient of variation across 100 runs on GitHub-hosted runners — enough that a 2% regression gate has a 45% chance of firing a false positive. To hold false positives near 1% you’d have to loosen the gate to 7%, at which point it no longer catches anything you’d care about. The gate is either crying wolf or blind. There is no threshold that is both.
Here’s the detail that never makes it into the shift-left posts. Everyone quotes the public-repo runner spec — 4 vCPUs, 16 GB. Your enterprise monorepo is a private repo, and GitHub gives private repos half of that: 2 cores and 8 GB. You are generating load and absorbing it on two shared cores. The load generator saturates before the service under test does, and you end up benchmarking your own test harness.
The line is deterministic vs statistical — not cheap vs expensive
Everyone tiers their pipeline by cost: fast tests on the PR, slow tests nightly. That’s the wrong axis. The right one is whether a failure is a fact or a probability.
A deterministic check has zero variance. Run it twice on the same commit, get the same answer. It can block a merge, because red is a statement about the diff. A statistical check has a distribution, and on shared infrastructure the odds that red means “real regression” are worse than a coin flip.
| Blocks the PR (deterministic) | Never blocks the PR (statistical) |
|---|---|
Bundle size budget (size-limit) | p95 / p99 latency under load |
| Query count assertions | Throughput (req/s) |
| Allocation and object-churn counts | Soak, spike, and stress results |
| Payload size, response field count | Lighthouse performance score |
| Static N+1 detection | Anything measured in wall-clock on a shared runner |
Instruction-count benchmarking — CodSpeed and friends — is the edge case that proves the axis rather than breaking it. Counting CPU instructions sidesteps the wall clock entirely, which makes it deterministic, which is exactly why it can block a merge. It’s the stopwatch that has to go, not the ambition.
Lighthouse belongs on the right-hand side
This is where most teams draw the line wrong. Lighthouse feels like a cheap PR check, so it gets filed next to bundle size. It isn’t the same species. The Lighthouse team’s own variability docs note that “the median Lighthouse score of 5 runs is twice as stable as 1 run,” then say the quiet part out loud about where you’re running it: “Free CI environments and ‘burstable’ instances are typically quite volatile.” A metric whose own maintainers tell you to take a median of five is a statistical metric. Gating on a single Lighthouse run is the same mistake as gating on p95, with a nicer report attached.
What I actually keep on the merge gate
The steel-man deserves a real concession: some performance checks are deterministic, cheap, and belong on the PR. A query-count assertion catches the N+1 that a load test would only catch later, in aggregate, ambiguously:
@Testvoid loadingPolicyListIssuesTwoQueries() {    Statistics stats = sessionFactory.getStatistics();    stats.setStatisticsEnabled(true);    stats.clear();
    policyService.findActivePoliciesFor(CLIENT_ID);
    // One query for the list, one for the batch-fetched holders.    // If this hits 51, someone reintroduced the N+1 in the holder mapping.    assertThat(stats.getPrepareStatementCount()).isEqualTo(2);}
Assert on getPrepareStatementCount(), not getQueryExecutionCount() — the latter counts executed queries (HQL/JPQL, criteria, and native SQL), and lazy-load initialization doesn’t go through that counter, so an N+1 storm sails straight past it. That’s the most common way I see this check written wrong, and it makes the assertion worthless precisely when you need it.
This assertion fails for exactly one reason: the diff changed how many queries the code issues. Noisy neighbours can’t make it flake. Neither can a GC pause. It runs in milliseconds, and when it goes red the author knows what they broke. Counts and bytes on the PR. Stopwatches never.
Shift-left is right — and its own sources agree with me
The shift-left camp isn’t wrong about what it actually claims. Performance regressions are cheaper to catch early, and finding a 3× latency regression the week before launch is a disaster — I’ve watched teams pay for it, usually the ones where only QA is expected to care.
But “learn early” and “block the merge” are different demands, and the literature the vendor blogs cite for authority never conflated them:
- DORA puts an upper limit of about 10 minutes on test feedback, and measures performance-test health by whether developers get feedback from them within a day. Within a day. Not within a pull request. Our 18-minute gate broke DORA’s rule on its own, before it measured anything.
- Grafana k6’s own docs state it plainly: “we advise not to run larger tests in pipelines meant for automatic deployment.” The leading load-testing vendor does not recommend what the load-testing blogs recommend.
So keep the k6 script. Keep the thresholds. Just stop attaching them to a required status check:
export const options = { thresholds: { // Real thresholds — evaluated nightly on pinned hardware, // where p(95) means something. k6 exits 99 when these fail. http_req_duration: ['p(95)<500'], },};Making that job non-blocking isn’t continue-on-error. A workflow blocks a merge only if its check name sits in the repo’s required status checks list, so the fix is to leave it out of the list.
What the re-run button teaches your team
This is the damage that outlives the perf tests, and the reason I’d rip the gate out even if it were free.
The gate goes red. The author knows their diff was a CSS change. They hit Re-run jobs. It goes green. They merge. Within a month everyone has learned that a red perf check is a coin flip and that re-running is cheaper than reading. Someone eventually adds automatic retries to stop the complaints, at which point the gate can no longer fail and nobody notices, because it still shows green and it’s still on the compliance slide. That’s a green run that proves nothing — and the habit doesn’t stay in its lane. A team that learns to reflexively re-run one red check has learned to re-run all of them.
A performance testing CI pipeline strategy: where each test goes
The decision rule, which is the thing worth stealing:
- PR pipeline — fast, and its failure is unambiguously caused by this diff. The left-hand column above. Blocks the merge.
- Nightly — statistically noisy, or needs a warm, production-like environment. Full k6 load runs on pinned hardware. Files an issue; blocks nothing; pages nobody.
- Release gate — expensive, environment-specific, and blocking is genuinely acceptable because a human is already in the loop. Soak and spike on prod-like infra, against an SLO somebody signed.
The nightly job’s real failure mode is being ignored
“Just run it nightly” is useless advice on its own, and it’s the honest weak point of my own recommendation. Two things make the nightly carry its weight — and neither is a rota, because a nightly with no single named owner is a graveyard.
Alert on trend breaks, not threshold crossings. An absolute p(95)<500 on a nightly is just a slower version of the PR gate. Compare each run against a rolling baseline of the previous 7–14 nights and alert when a run deviates from its own history. That’s the only way to catch the regression that creeps 4% a week and never trips an absolute number — the one class of regression a PR gate structurally cannot see, because it never looks at more than one commit.
Bisecting is the strongest argument against me. Yes, moving perf off the PR path means a regression arrives buried in a batch of twenty merges. That’s survivable, because you bisect with the deterministic proxies — re-run query counts and allocation counts across the batch in seconds. The checks that earn their place on the PR gate are the same ones that make the nightly bisectable. They pay twice.
What I’d do differently
I’d have run the gate in advisory mode for a month before making it required: post the k6 result as a PR comment, block nothing, and count how often it would have been wrong. We had every number needed to predict the 41-to-3 disaster and never looked before flipping the switch. A gate should earn its merge-blocking privileges by first demonstrating a false-positive rate you can live with. (Those 18 minutes were also hiding inside a suite already slow for five other reasons — killing the gate made us feel fast enough that we nearly stopped there.)
Do this today
Open your PR pipeline and find every check that measures wall-clock time on a shared runner. Pull two numbers from your CI history: how many times it was re-run, and how many of those re-runs found a real bug. If the ratio looks anything like our 340 to 9, you don’t have a quality gate — you have a coin flip that thirty engineers are paying for. Move it to the nightly tonight.
Should performance tests run on every pull request?
Only the deterministic ones. Query-count assertions, bundle-size budgets, and allocation counts have zero run-to-run variance, so a red result is caused by the diff and can safely block a merge.
Statistical checks — p(95) latency, throughput, Lighthouse scores — should not run on the PR path. On shared CI runners their failures are dominated by infrastructure noise rather than by code changes.
Why does my k6 threshold fail in CI but pass locally?
Shared CI runners have noisy neighbours, cold caches, and cold JIT. A GitHub-hosted runner on a private repository gets 2 vCPUs and 8 GB of RAM, so your load generator often saturates before the service under test does.
Your laptop has more cores, warm caches, and no contention — so the same script passes there.
Do k6 check failures fail my CI build?
No, and this catches people out. In k6, only thresholds affect the exit status — a failed threshold exits 99, while failed check() calls exit 0.
A pipeline that asserts with checks alone will stay green straight through a real regression. Most teams find the gap only after shipping one.
Doesn't moving perf tests to nightly make regressions harder to bisect?
Slightly — and it’s the strongest objection to this approach.
The fix is to bisect using the deterministic proxies that live on the PR gate: query counts, allocation counts, bundle size. You can re-run those across a batch of merges in seconds. They pay for themselves twice — once as merge gates, once as bisection tools.
How do you stop a nightly performance job from being ignored?
Give it one named owner who triages the result each morning, and alert on trend breaks against a rolling 7-to-14-night baseline rather than on absolute thresholds.
Trend-based alerting also catches the slow regression that creeps a few percent per week and never trips a fixed threshold — the one class of regression a PR gate structurally cannot see.
Don't miss a thing
Subscribe to get updates straight to your inbox.

No spam · Unsubscribe anytime