Your QA Metrics Are Lying to Leadership
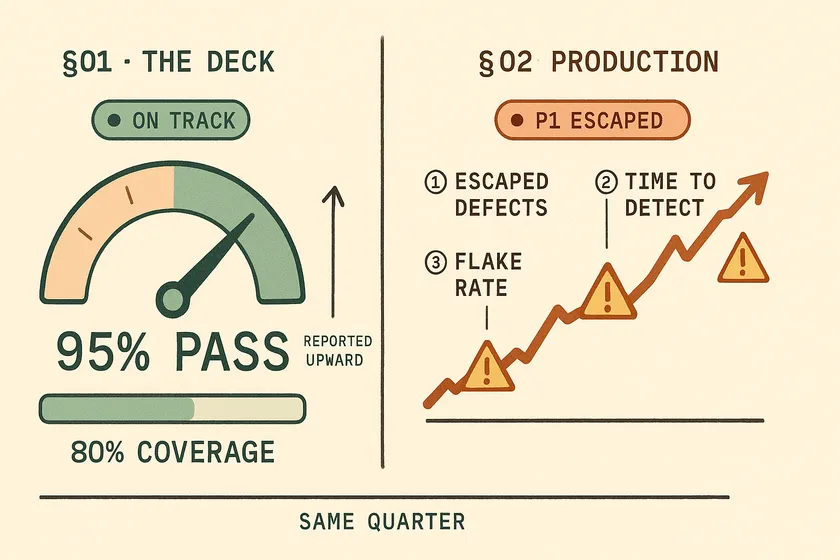
Table of Contents
For two quarters I stood in a steering committee at a large Canadian insurer and reported a 95% pass rate against 81% code coverage to leadership. Both numbers were true. Over those same two quarters, P1 and P2 production incidents went from 9 to 14. Nobody in that room — including me — could explain the gap, because the QA metrics on that slide had almost no causal relationship with the question we were being asked.
The dashboard wasn’t broken. It was measuring exactly what we had told it to measure. Our suite tested the easy paths, and the easy paths are precisely what make those two numbers go up.
Why is test pass rate a bad metric for leadership?
Pass rate is a bad leadership metric because it measures the behaviour of your test suite, not the quality of your product — and the suite is the thing you control. Any number you can move by changing your own code, without touching the product, is a report on your team’s habits. It is not a report on quality.
This is Goodhart’s Law with a Jira ticket attached: when a measure becomes a target, it ceases to be a good measure. Once pass rate is the number on the slide, the cheapest way to move it is never “find and fix a hard defect.” It’s to add retries, split a long test into five short ones, quarantine the test that keeps going red, or write six more tests against the login page you already trust.
The empirical case is worse than the theoretical one. Google reports that about 84% of the transitions they observe from pass to fail involve a flaky test, and almost 16% of their tests have some level of flakiness. Sit with that. At one of the most disciplined testing organizations on earth, the large majority of newly-red builds are noise. Which means the delta between a 95% pass rate and a 99% pass rate is substantially a measurement of how aggressively a team retries — not of how good the software is.
I’ve written before about the five patterns that turn a green suite into a liar — dismissed alerts, deleted assertions, escalating retries. Here’s the sentence I couldn’t write then, because I hadn’t yet connected it to the reporting line: every one of those five patterns is a rational response to being measured on pass rate. The engineer suppressing that failure isn’t lazy. They’re optimizing the metric you put on the wall.
Your 99% pass rate may be a config setting
This is the part that should worry you, and almost nobody says it out loud. The single most effective way to raise a pass rate requires no new tests, no bug fixes, and no code review. It’s one line:
export default defineConfig({ // Every test now gets three chances to be green. retries: 2, reporter: [['json', { outputFile: 'results.json' }]],});That’s it. Ship that, and a suite failing 6% of the time reports somewhere north of 99% by Friday, because most flakes don’t fail three times in a row. The tests didn’t get better. The product didn’t get better. A number in a config file got bigger, and the number on your VP’s slide followed it. Nobody lied. Nobody even did anything unreasonable — go looking for advice on hitting a pass-rate target and “turn on retries” is the answer you’ll be handed, because it works.
Pass rate is an alert, not a KPI
I want to be precise, because I’ve argued the other side of this. Elsewhere on this blog I recommend Slack alerts that go red below a 95% pass rate, and I stand by that. The distinction is the job you’re asking the number to do:
- As an operational alert, pass rate is excellent. “Did something break in the last hour?” is exactly what it answers. It’s cheap, fast, and it pages the right person.
- As a leadership KPI, pass rate is close to useless. “Is our product getting better?” is a question it cannot answer, because a suite that never finds anything scores a perfect 100%.
Same number, two jobs. It can only do one of them well. The mistake isn’t tracking pass rate — it’s promoting it to the executive deck.
Coverage has the same disease
Code coverage tells you a line executed. It never tells you anyone checked the result. Martin Fowler’s position has been the correct one for two decades: “Test coverage is a useful tool for finding untested parts of a codebase. Test coverage is of little use as a numeric statement of how good your tests are.” The research says the same — coverage “should not be used as a quality target because it is not a good indicator of test suite effectiveness” once you control for suite size.
I’ve made the full case against coverage percentages separately, so I won’t relitigate it here. The short version: coverage measures execution, mutation score measures detection, and only one of those is quality. Coverage’s one honest use is inverted — a low number reliably tells you something is completely untested. A high number tells you nothing at all.
What QA metrics should you report to leadership instead?
Report three: escaped-defect rate, mean time to detect, and flake rate. Together they answer the only question leadership is actually asking — are we catching problems before customers do, and are we getting faster at it? Pass rate and coverage answer a different question that nobody asked.
The split that matters is not “good metrics vs. bad metrics.” It’s which dashboard a metric belongs on:
| Practitioner dashboard (the team looks daily) | Steering-committee dashboard (leadership looks monthly) |
|---|---|
| Pass rate — is the pipeline red right now? | Escaped-defect rate — are we catching things before customers? |
| Code coverage — which files have no tests at all? | Mean time to detect — how long do defects live undetected? |
| Suite duration — is feedback still fast? | Flake rate — can we trust any of the above? |
| Individual test failures | Trend direction over 2+ quarters, not this week’s number |
1. Escaped-defect rate
The formula is unglamorous: defects found in production, divided by total defects found, over a release window.
The instrumentation is a single mandatory field on your bug type. In Jira, add a custom select field — I call it Phase Found — with the values the defect could have been caught in, and make it required at creation. Then escaped-defect rate is one JQL query away:
The numerator is the defects that reached customers. The denominator is every defect you found anywhere. Two queries, one quarter:
project = PLATFORM AND issuetype = Bug  AND "Phase Found" = Production  AND created >= startOfMonth("-3")
project = PLATFORM AND issuetype = Bug  AND created >= startOfMonth("-3")
The hard part is not the query. It’s that the argument about what counts as “escaped” is the actual work, and it will take you three weeks. Is a bug found in UAT escaped? (No — you caught it.) A bug found in production by an internal user before any customer hit it? (Yes. It reached production. You do not get credit for luck.) A bug in a feature behind a flag that’s off? (No.) Write the definition down, get dev and support to sign it, and never quietly renegotiate it mid-quarter — the moment you do, the metric is worthless and everyone will know.
Two guardrails, both of which you should say out loud before anyone else raises them.
Weight it by severity, or it will lie too. A 10% escape rate made entirely of P1s is far worse than a 30% rate of cosmetic P3s, and a raw percentage flattens that distinction into nothing. Report the rate split by severity, or you’ve just built a more sophisticated vanity metric.
Never attach it to an individual. The moment escaped-defect rate lands in someone’s performance review, you have created an incentive to not file bugs, to reclassify defects as “enhancements,” and to quietly negotiate severity downgrades with support. Escaped-defect rate is a property of a system — the design, the tests, the review process, and the accountability structure that decides who owns a defect in the first place. Used on a team, it’s the best quality signal you have. Used on a person, it’s a machine for manufacturing dishonest data.
Then steel-man the last objection, because a sharp executive will find it: the denominator is unknowable. You cannot count the defects you never found. That’s true. It means escaped-defect rate is a trend metric, not an absolute score. Compare it to yourself last quarter, and never benchmark it against another company’s number — theirs is measuring a different definition, badly.
2. Mean time to detect
MTTD is the median time from the commit that introduced a defect to the moment anyone noticed. Most articles confuse it with MTTR — recovery time is how fast you fix, detection time is how long you were blind. Only one of those is a testing metric.
You don’t need a platform to compute it. For each P1 and P2 from last quarter, you need two timestamps: when the defect entered production, and when anyone first noticed. Git gives you the first — git log -S finds the commit that introduced the buggy line your fix deleted:
# The commit that first introduced the line this fix removed.# Spot-check the result — it's a strong heuristic, not an oracle.buggy_line=$(git show "$FIX_SHA" | grep '^-[^-]' | head -1 | cut -c2-)git log -1 --format='%cI %h %s' -S"$buggy_line" "$FIX_SHA^"Take the median across the quarter, never the mean — one six-month-old defect will wreck an average and teach you nothing.
The detection timestamp is the weak link, and the “just add a Jira field” advice always skips this. A Jira ticket’s created date is when a human got around to filing, which can trail real detection by days. If you have Sentry, Datadog, or PagerDuty, take the earliest of (alert fired, incident opened, ticket created). MTTD is inherently a join across your tracker, your monitoring, and your deploy records — half the data was never in Jira to begin with.
There is no credible industry benchmark for MTTD, and anyone who quotes you one invented it. What matters is the shape of your own curve. At the insurer, our median MTTD across P1/P2 defects was 19 days. Nineteen days is not a testing problem; it’s a detection problem, and it told us something pass rate never could: our tests weren’t running against anything that resembled production data.
3. Flake rate
Flake rate is the percentage of tests that fail and then pass on retry with no code change. It’s the metric that validates the other two — because if flake rate is high, every other number on the dashboard is noise.
Playwright gives it to you for free. A test that fails then passes on retry is reported with status flaky, and the JSON reporter aggregates it in stats:
import fs from 'node:fs';import type { JSONReport } from '@playwright/test/reporter';
const report: JSONReport = JSON.parse(fs.readFileSync('results.json', 'utf-8'));const { expected, unexpected, flaky } = report.stats;
const executed = expected + unexpected + flaky;console.log(`flake rate: ${((flaky / executed) * 100).toFixed(2)}%`);
Retries must be enabled or nothing is ever classified as flaky — which is its own quiet irony: a suite with retries off has a flake rate of zero and a pass rate that tells the truth. Chart this on every main-branch run.
My budget is under 2% of executed tests, and I’ll be honest that this is my number, not an industry standard — there isn’t one. For calibration, Google reports about 1.5% of all test runs come back flaky and that they can’t drive it to zero; the insertion rate roughly matches the fix rate. Treat flake as a permanent tax you keep small, not a problem you finish. Above 10%, stop reporting quality metrics altogether and go fix the suite, because none of them mean anything yet.
Flake rate also earns its place by being diagnostic, not just hygienic. A rising flake rate is a symptom with a cause: a 23% flake rate that turned out to be 31 missing awaits, or the “flaky” test that was a genuine race condition all along. The flakes were telling the truth. We just weren’t listening.
How do you sell this to leadership attached to the pass-rate dashboard?
Carefully, slowly, and never by attacking the old number in a meeting. The pass-rate dashboard is not on the wall because your VP is naive. It’s there because it is the only number in the deck that ends the conversation, and any metric you propose has to be able to do that job too — or it will be rejected no matter how correct it is.
Understand what the number is actually for
Your VP has been reporting “95% pass rate, green” upward for six quarters. That number buys them a short agenda item and an untroubled CTO. Walking in and calling it a vanity metric doesn’t only attack the metric — it retroactively attacks every status report they’ve filed since last year. You will lose, and you’ll deserve to.
Pre-frame the trust valley before you show a single number
Here is the political trap that kills this initiative, and I walked straight into it the first time. The moment you start measuring escaped defects honestly, quality appears to collapse — not because anything got worse, but because you finally started counting. Our escaped-defect rate “jumped” to 31% in the first month. Nothing had changed. We’d simply started writing down what had been true all along.
Present that 31% cold and you’ve handed leadership a chart showing quality fell off a cliff the exact quarter QA changed the metric.
Name the owner, or it dies in committee
Pass rate survives because QA owns it end to end. Escaped-defect rate is owned by nobody — it needs dev, support, and product to agree on what “escaped” means and to fill in a field they didn’t ask for. A metric with no owner quietly stops being populated by week five. Walk in with a named owner and a signed definition, or don’t walk in.
Run both in parallel for one quarter
Don’t ask anyone to delete anything. Keep the pass-rate slide exactly where it is and add three shadow metrics beside it. Then wait — and this is the easy part, because it always happens — for the release where a P1 escapes to production while the dashboard is green.
That release is your entire argument. You don’t have to make it; the data makes it. You just have to have been measuring for a quarter when it arrives, so you can put both charts on one page.
Borrow legitimacy from DORA — but don’t oversell the mapping
The fastest political path is not inventing a metric, it’s docking yours to one they already respect. DORA’s change fail rate is the closest thing your CTO already reports, so leading with it asks leadership to extend a framework rather than learn a vocabulary.
Be honest about the seam, though, because a sharp exec will find it. Change fail rate is deployment-scoped — it counts deploys that needed immediate intervention. Escaped-defect rate is defect-scoped. A bug that ships on Tuesday, sits quietly for three weeks, and gets reported by a customer is not a DORA change failure; nothing needed intervention at deploy time.
That gap is the argument, not a weakness in it. The pitch: “We already report change fail rate. It catches the loud failures. These three catch the quiet ones — and the quiet ones are what our customers are finding.”
31% → 12%
Escaped-defect rate
19d → 4d
Median time to detect
11% → 3%
Flake rate
14 → 6
P1/P2 incidents per quarter
Two quarters after the switch at the insurer, those were the numbers. Notice what isn’t in that table: pass rate. It drifted down — from 95% to around 91% — as we deleted quarantined tests, stopped retrying our way to green, and wrote tests against paths that were genuinely hard.
Our dashboard got worse and our product got better. That’s the sentence I’d put on the slide.
What I’d do differently
I led with the argument instead of the evidence. My first attempt was a well-reasoned deck explaining why pass rate was misleading, delivered to people who had been reporting pass rate upward for eighteen months. It went exactly as well as you’d expect — I was politely told the current metrics were “working fine.”
What worked was shutting up and measuring quietly for a quarter, then bringing a single slide with two lines on it: the green pass-rate line, flat and reassuring, and the incident count climbing underneath it. I said almost nothing. The chart did it.
The other thing I’d change: I’d have added flake rate first, alone, before proposing anything else. It’s the least political of the three — nobody has ever defended flaky tests in a meeting — and it buys you the credibility to propose the two that actually threaten someone’s status report.
Your next step
Don’t propose anything this quarter. Open a spreadsheet, write down your definition of “escaped,” and start counting — privately, for ninety days. Bring the divergence to the meeting, not the argument. The chart where your green line and your incident line cross is worth more than any deck you could build, and if your metrics are lying to leadership the way mine were, that chart is already forming.
What's the difference between defect escape rate and defect removal efficiency?
They’re two views of the same data. Defect removal efficiency (DRE) is the percentage of defects found before release; escaped-defect rate is the percentage found after. A DRE of 85% means an escape rate of 15%.
Use DRE with executives who already know the term — Capers Jones calls it the single most important metric for software quality. Use escape rate with engineers. The failure framing is more motivating than the success framing.
Is a 100% test pass rate a red flag?
Yes. A suite that never fails is either testing paths that cannot break, or it has been tuned to stop reporting failures — through retries, quarantines, and deleted assertions.
A healthy suite that tests genuinely hard paths should fail sometimes. That is what it is for. Sustained 100% is not an achievement; it’s a smoke alarm with the battery removed.
What flaky test rate is acceptable in CI?
Under 2% of executed tests. Google’s CI research reports that roughly 16% of their tests exhibit some flakiness and 84% of pass-to-fail transitions involve a flaky test — and they treat flake as a permanent tax rather than a solved problem.
Above 10%, stop reporting quality metrics altogether and fix the suite. None of your other numbers mean anything until the signal is trustworthy.
How often should QA metrics be reported to executives?
Monthly at most, and always as a trend across at least two quarters.
Escaped-defect rate and MTTD are noisy week to week, and reporting them weekly invites over-reaction to normal variance — which is how a good metric gets gamed into a bad one. Pass rate can stay on a real-time operational dashboard where it genuinely helps. Just not in the executive deck.
Which QA metrics map to DORA metrics?
Escaped-defect rate maps closely to DORA’s change failure rate, and mean time to detect is the missing front half of failed-deployment recovery time — you cannot recover from what you haven’t noticed.
Mapping your metrics onto DORA is the fastest route to executive buy-in. It asks leadership to adopt a framework their peers already report, rather than a QA-specific vocabulary you invented.
Don't miss a thing
Subscribe to get updates straight to your inbox.

No spam · Unsubscribe anytime